
File:Sphere with chart.png
- File
- File usage
- Learn more about Schools Wikipedia
Size of this preview: 297 × 480 pixels.
| |
This is a file from the Wikimedia Commons. Information from its description page there is shown below.
Commons is a freely licensed media file repository. You can help. |
 |
File:Sphere with chart.svg is a vector version of this file. It should be used in place of this raster image when superior. File:Sphere with chart.png
For more information about vector graphics, read about Commons transition to SVG.
|
 |
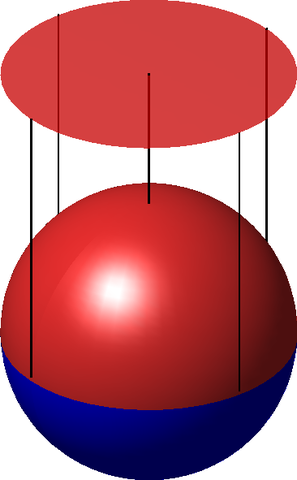
A sphere with the chart mapping the upper hemisphere to a disk.
Created by me using Matlab.
Licensing
 |
I, the copyright holder of this work, release this work into the public domain. This applies worldwide. In some countries this may not be legally possible; if so: I grant anyone the right to use this work for any purpose, without any conditions, unless such conditions are required by law.
|
Matlab source
clf;
hold on;
colormap([0 0 1; 1 0.2 0.2; 1 0 0; 0 0 0]);

[sx,sy,sz] = sphere(49);
sc = [ ones(24,50); 2*ones(26,50) ];
surf(sx,sy,sz, sc, 'EdgeColor', 'none', 'FaceColor', 'flat', ...
     'FaceLighting', 'phong');

sz2 = 2*ones(50,50);
sc2 = 3*ones(50,50);
surf(sx,sy,sz2, sc2, 'EdgeColor', 'none', 'FaceColor', 'flat', ...
     'FaceLighting', 'phong', 'FaceAlpha', 0.5);

[cx,cy,cz] = cylinder([0.005 0.005]);
cc = 4*ones(size(cx));

surf(cx+1, cy,   2*cz, cc);
surf(cx-1, cy,   2*cz, cc);
surf(cx,   cy+1, 2*cz, cc);
surf(cx,   cy-1, 2*cz, cc);
surf(cx,   cy,   cz+1, cc);

view(3);
camlight left;
axis equal;
axis off;
print -dpng spc_tmp.png
system('convert -trim spc_tmp.png spc.png');
Learn more about Schools Wikipedia
Schools Wikipedia has made the best of Wikipedia available to students. SOS Children is an international children's charity, providing a good home and loving family to thousands of children who have lost their parents. We also work with communities to help vulnerable families stay together and raise children in the best possible environment. There are many ways to help with SOS Children's Villages.